

Cooler September, Positioning for the Cycle's Final Leg.
A healthy and probable consolidation is underway following the new All-Time High in Ethereum. This is consistent with crypto’s pattern of front-running the broader equity markets, which now face a highly asymmetric risk profile.
With September rate cuts fully priced in, equities have minimal room for positive surprise and are acutely vulnerable to negative data, reinforcing our expectation of a cooler September.
While first-level thinking reacts to the pullback, second-level thinking recognizes this as a necessary and strategic phase. An ATH isn't an endpoint; it's a trigger to reassess the landscape and prepare for the next, final move. The real story is not the consolidation itself, but how to position within it.
The Structural Shift: Why This Consolidation is Different
What makes this cycle fundamentally different is the maturation of institutional-grade infrastructure. This new architecture is why we view the current consolidation as a structural re-accumulation, not a cyclical top.
The Infrastructure Revolution: Bitcoin ETFs now command trading volumes rivaling major exchanges and have achieved 5x higher penetration rates relative to market cap compared to gold ETFs. This suggests an accelerated and persistent institutional demand base.
The Game Has Been Re-Architected: Wall Street isn't just participating; they have built the machinery for this cycle. Well-funded treasury companies exist for systematic accumulation, while ETFs provide a clear, regulated path for eventual distribution to the masses.
The Staking Paradigm Shift: ETH's Supply Shock
The resilience of this consolidation is anchored by Ethereum's new fundamentals. Here's what the crowd is missing: 35 million ETH is now staked—29% of the total supply. This creates a structural supply shock while generating 7-8% yields that are immensely attractive to institutions. This repositioning of Ethereum as a productive, yield-bearing asset provides a powerful source of demand that absorbs selling pressure, giving this cool-off a solid foundation.
The Playbook: Positioning Through the Consolidation
Our analysis, derived from our models which weigh market structure, capital flows, and cyclical timing, is as follows:
- ETH: The Leader's Healthy Reset As the market leader, ETH is defining the character of this cool-off. We view this pullback not as risk, but as a strategic opportunity. August saw $4B in ETF inflows—institutional appetite remains robust. A healthy 10-15% "cool-off" is standard. We anticipate these flows will dampen volatility, making the $3,900-$4,100 zone an ideal entry to build positions for the next leg toward our conservative end-of-cycle target of $6,000-$8,000.
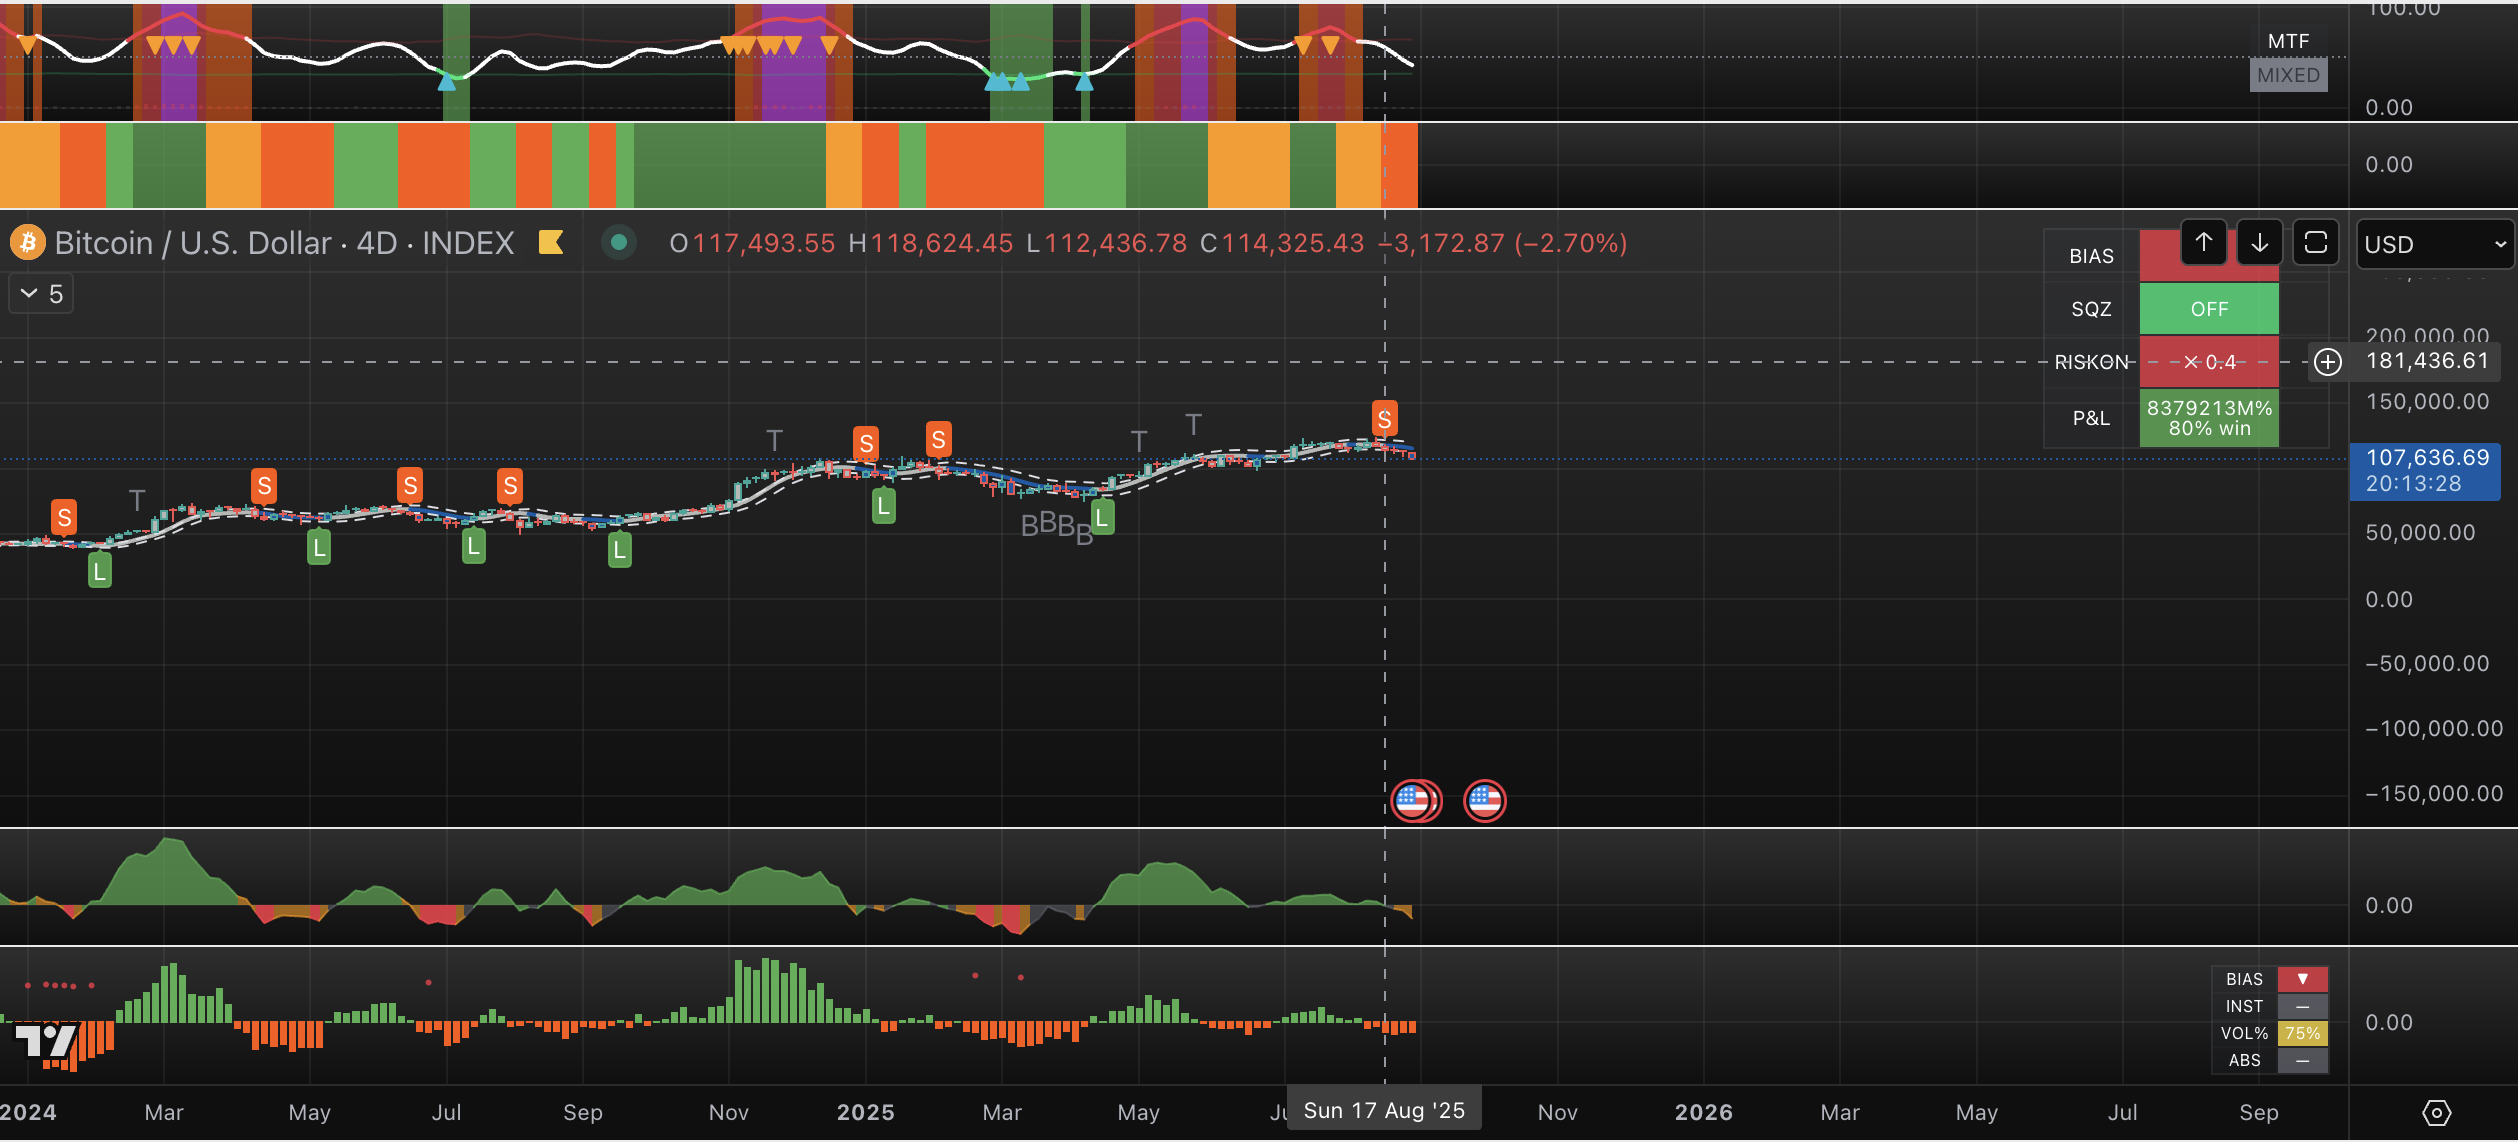
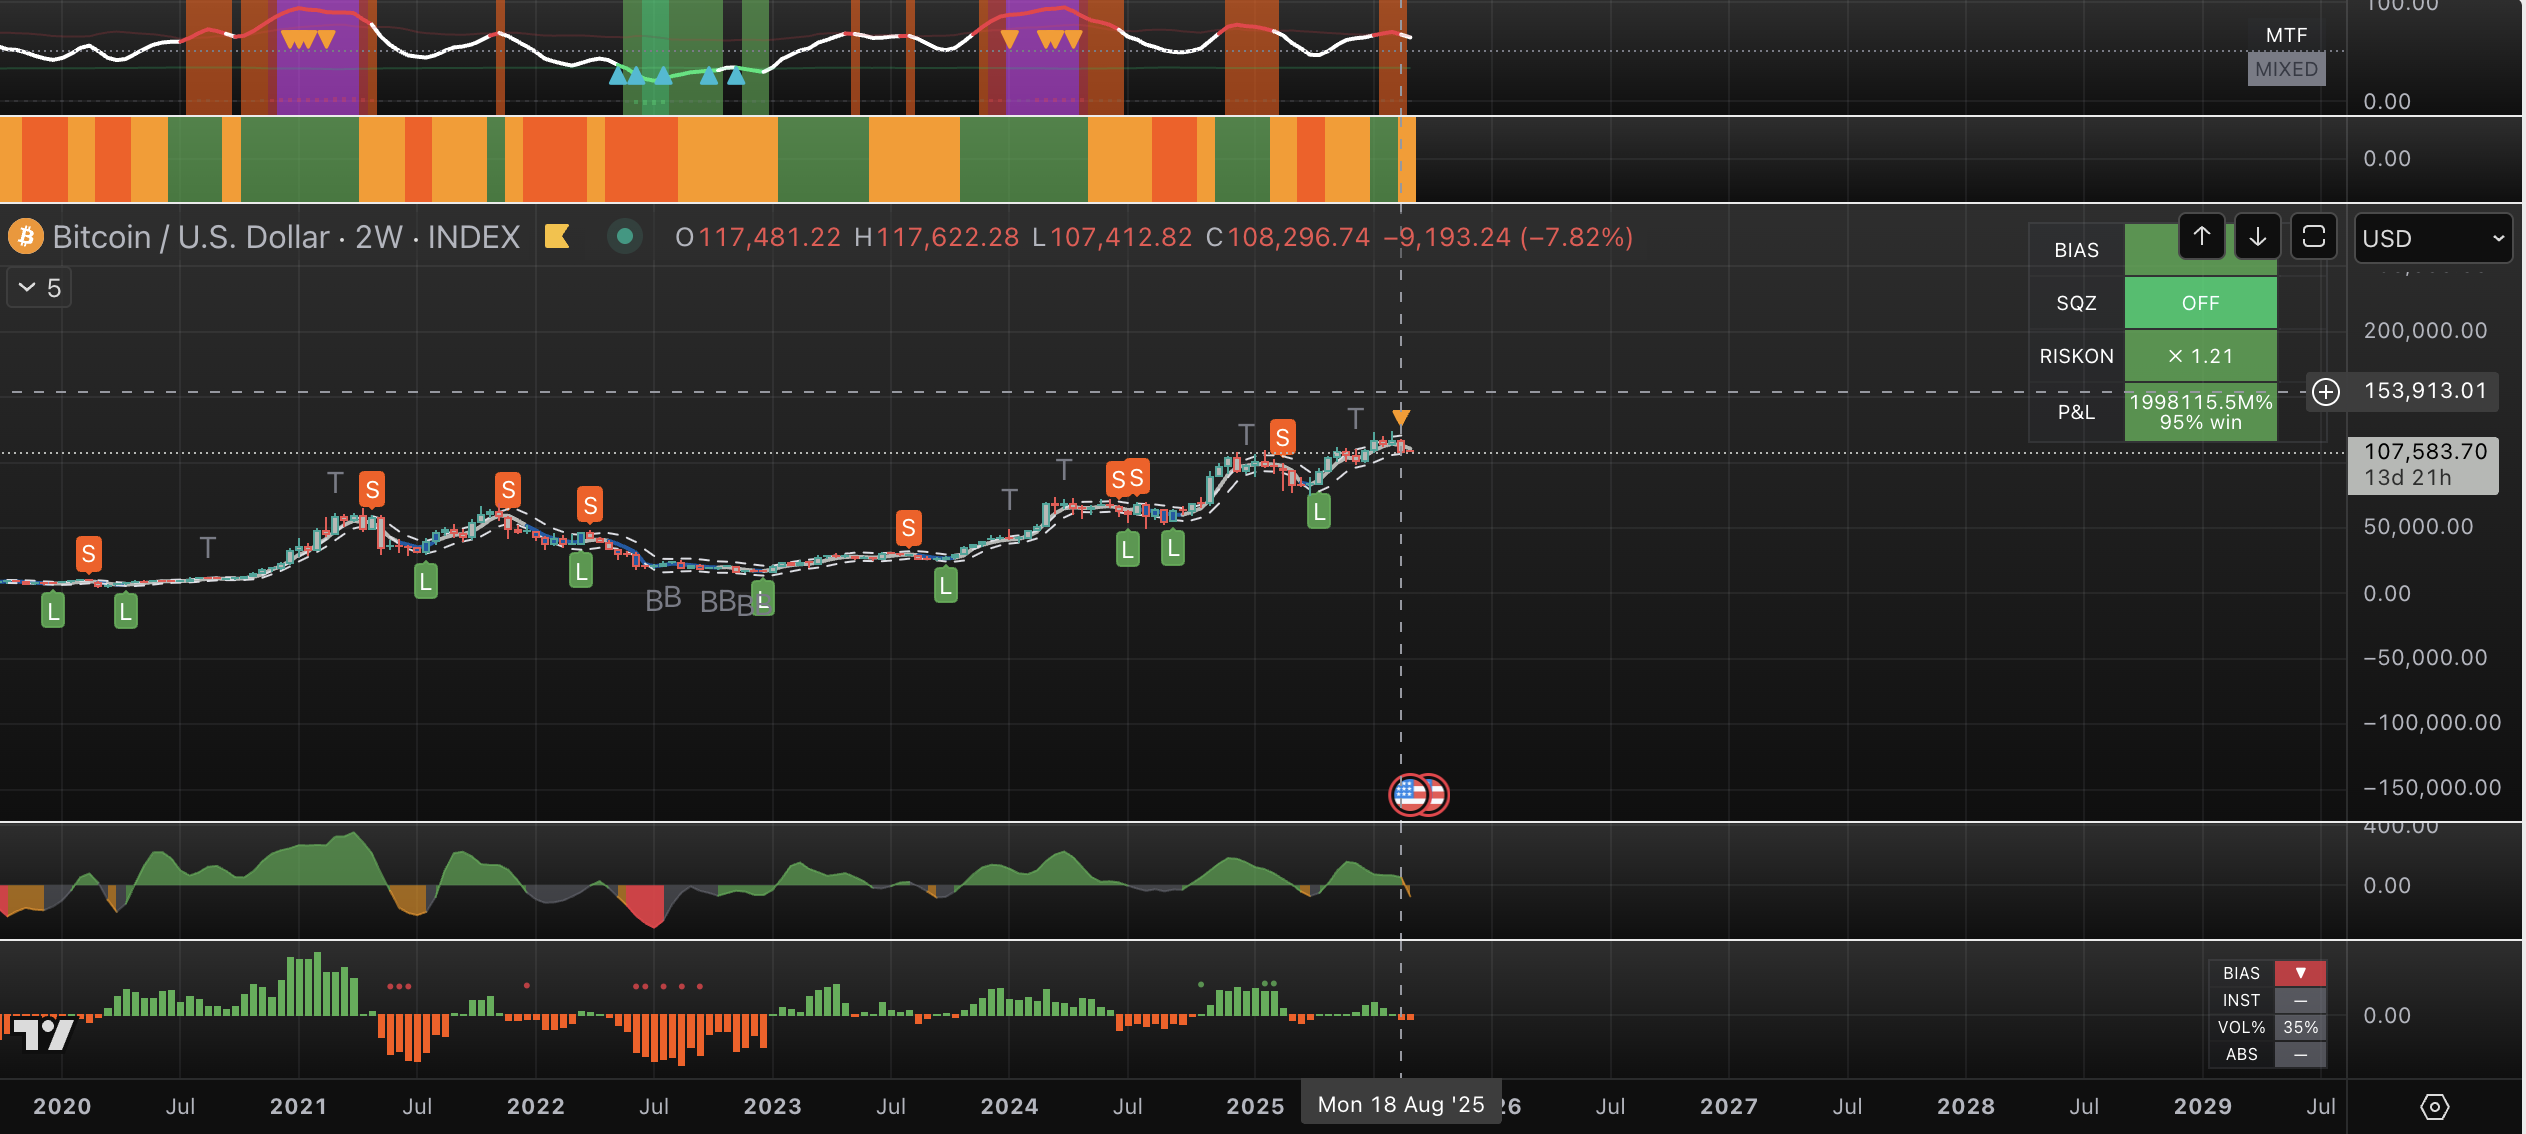
- BTC: The Consolidation Phase: The 4D sell signal on August 18th materialized successfully, calling the pullback from the $117k-$123k peaks. Our primary thesis (a 70% probability) is that the current $108k level marks a local bottom, representing the 80-day cycle low and initiating a 4-6 week consolidation. The probability of an absolute cycle top remains a tail-risk at ~30%, requiring confirmation from cascading sell signals on higher timeframes (1W/2W).
- However, a second-level thinker must also consider the potential headwinds. A more cautious view acknowledges that the era of "infinite money" for treasury-model companies is ending. This could create structural selling pressure, with a plausible, though lower-probability, scenario seeing Bitcoin test levels below $100k before the cycle concludes. This remains a key variable we are monitoring.
- Counterbalancing this caution is a recent, powerful signal: a likely buy signal is forming on
$MTPLF$, a well-run treasury company. This is a fascinating development. It suggests that despite the broader headwinds, sophisticated capital is still seeing value and positioning for another move higher in the ecosystem's bellwether assets. - BTC our working conclusion is this: The macro headwinds are real and will likely cap the ultimate upside of the cycle. However, the strength in key proxies like
$MTPLF$gives us higher conviction that the 80-day cycle low will hold, and that our primary thesis of a consolidation before another leg up is the most probable path forward.
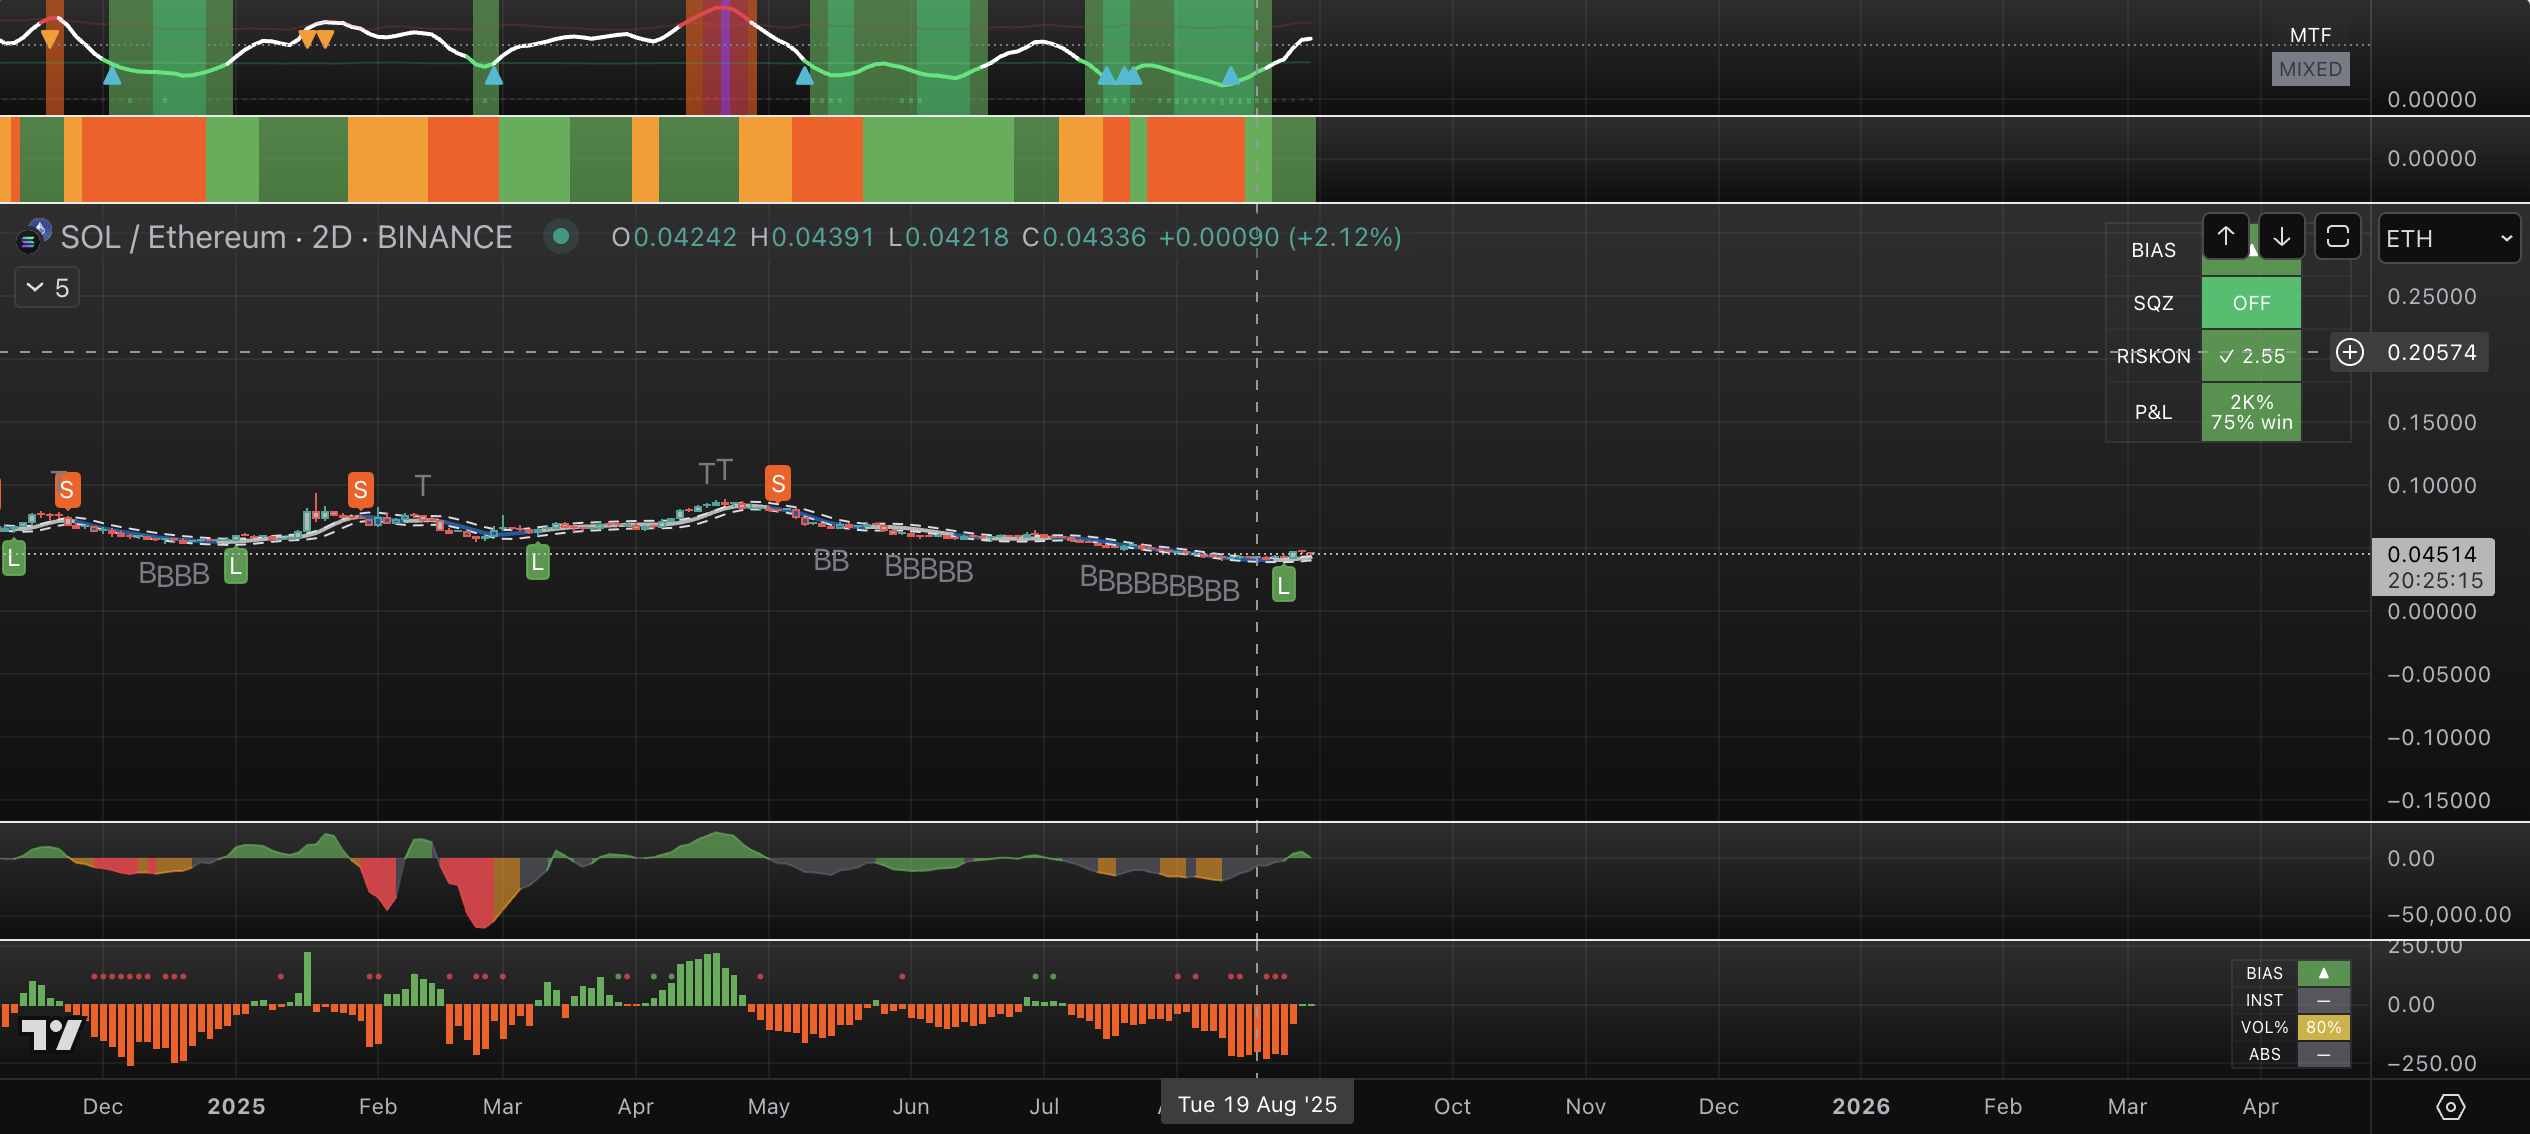
- SOL: The Capital Rotation Play With the majors consolidating, the second-level question is where capital will rotate next. We're observing initial footprints moving into the SOL ecosystem. The Alpenglow upgrade has positioned Solana as a premier institutional blockchain with 10,000 TPS throughput and $418M in tokenized real-world assets.
- The signal is clear: Wall Street is re-running the proven treasury diversification playbook with SOL as the high-performance infrastructure play. While the technicals and adoption metrics are impressive, we view Solana pragmatically: it is largely an investment in a high-performance "digital casino." This framing acknowledges its high-beta nature and reinforces the need for disciplined risk management even as the institutional playbook unfolds.
The Altcoins Conundrum
Our initial expectation was for altcoins to front-run the September rate cuts; however, only ETH received the memo. The broader altcoin market suffered a severe markdown of 40-55% from recent highs, but this was a necessary retail capitulation. While painful for undisciplined participants, this event has now formed the precondition for a true accumulation base, and we believe a significant bottom is close.
The data supporting a potential turn is compelling. Bitcoin Dominance has fallen decisively from 65% to 59%, a historical precursor to capital flowing down the risk curve. Concurrently, the OTHERS/ETH ratio remains deeply oversold but is showing early signs of recovery, indicating the period of maximum pessimism may be passing.
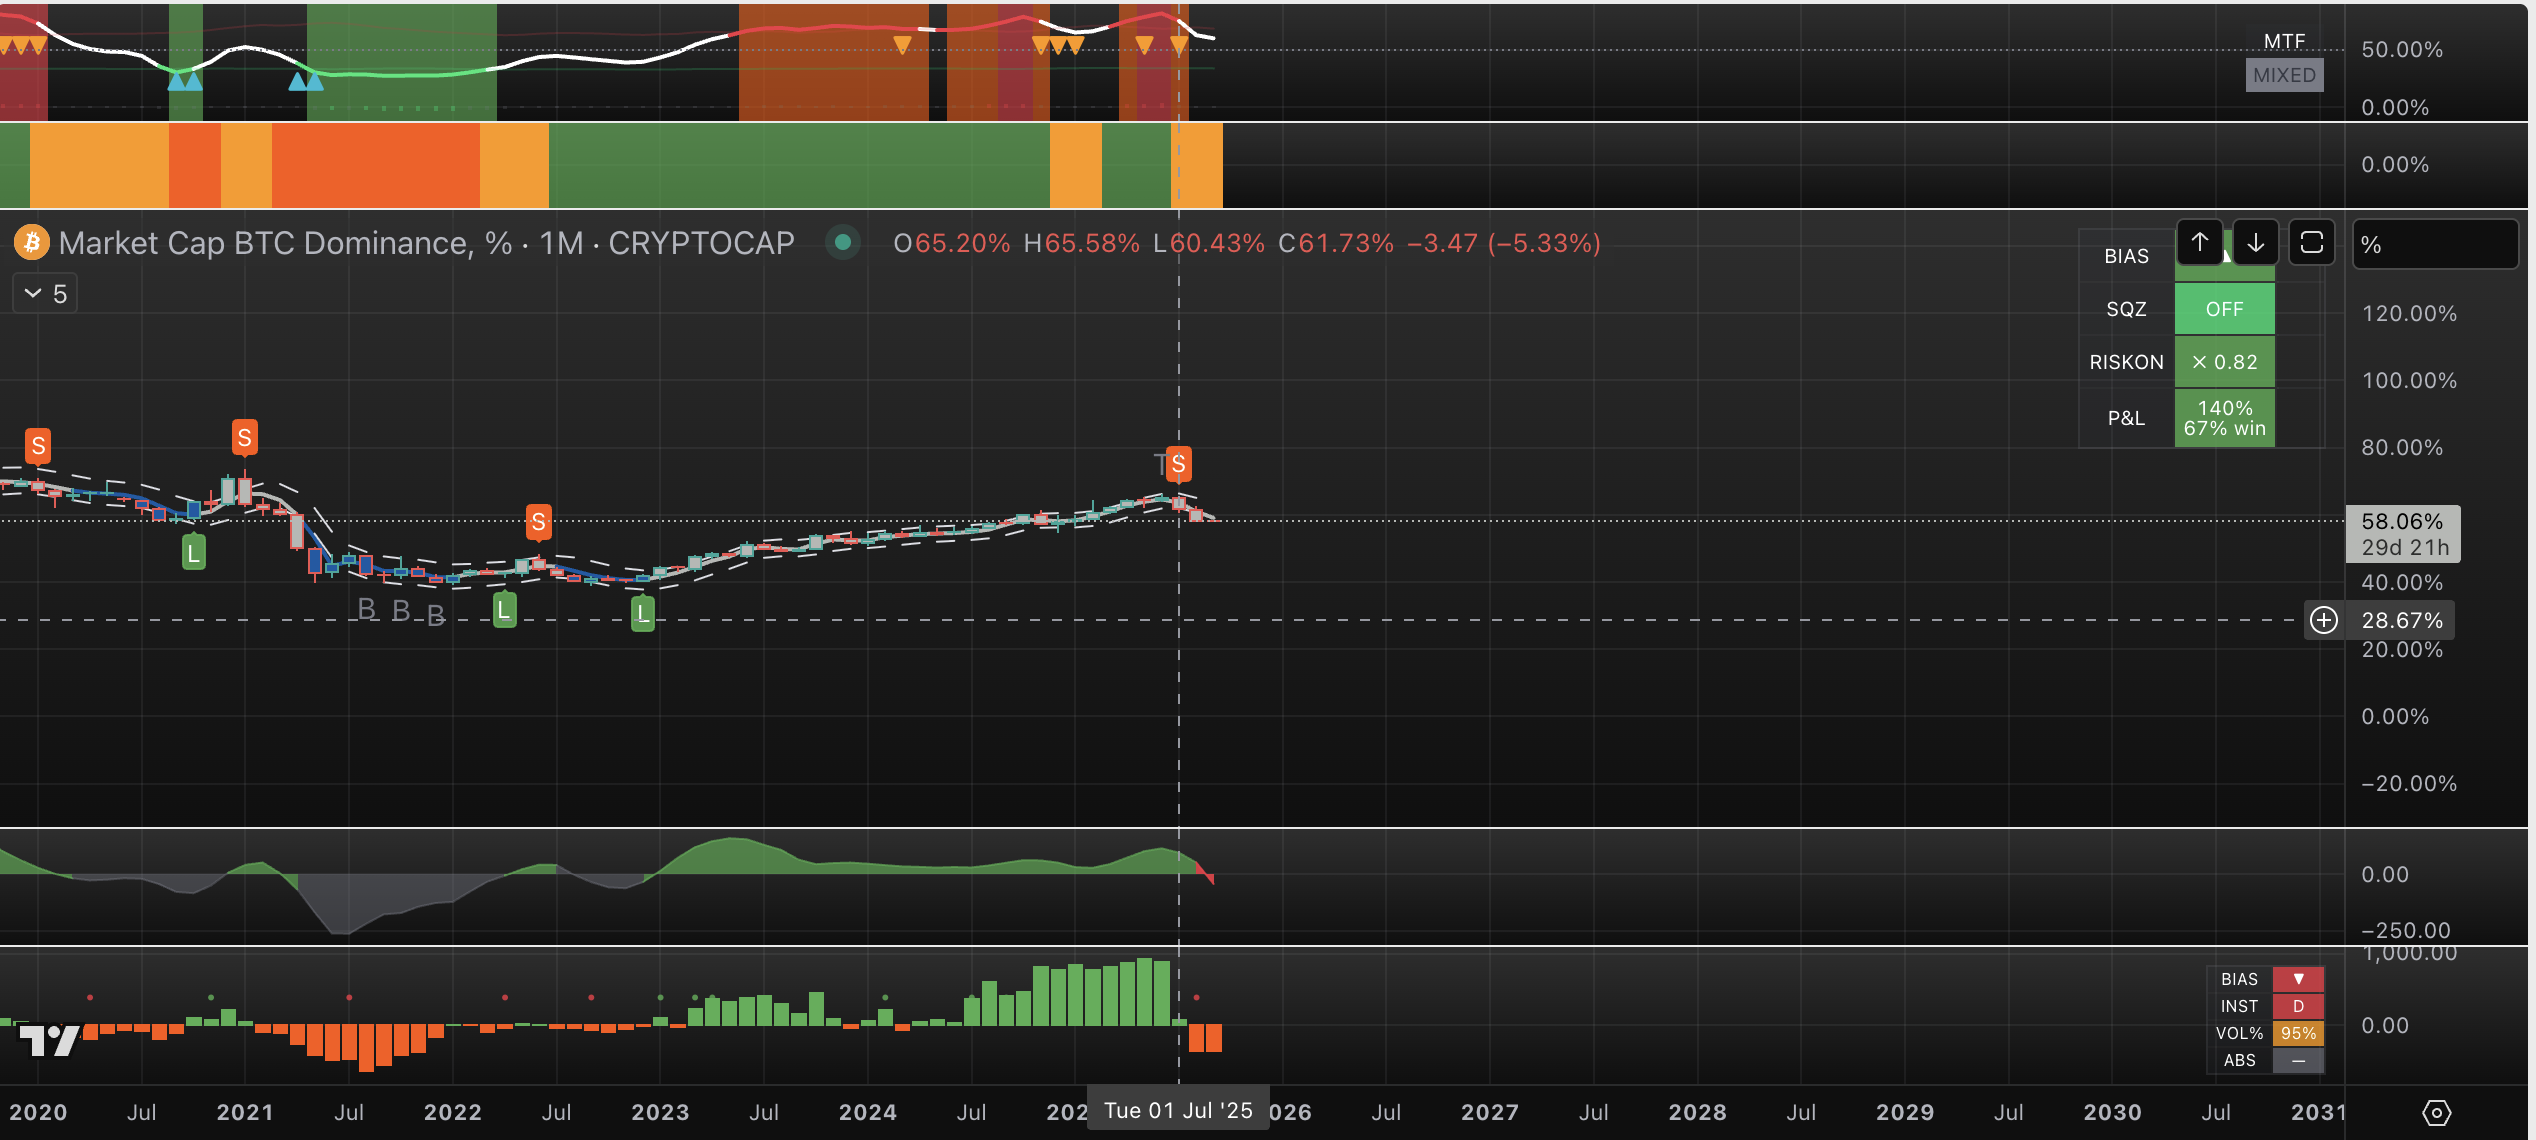
BTC Dominance Sell (S) signal on Monthly Timeframe - this is a strong signal.
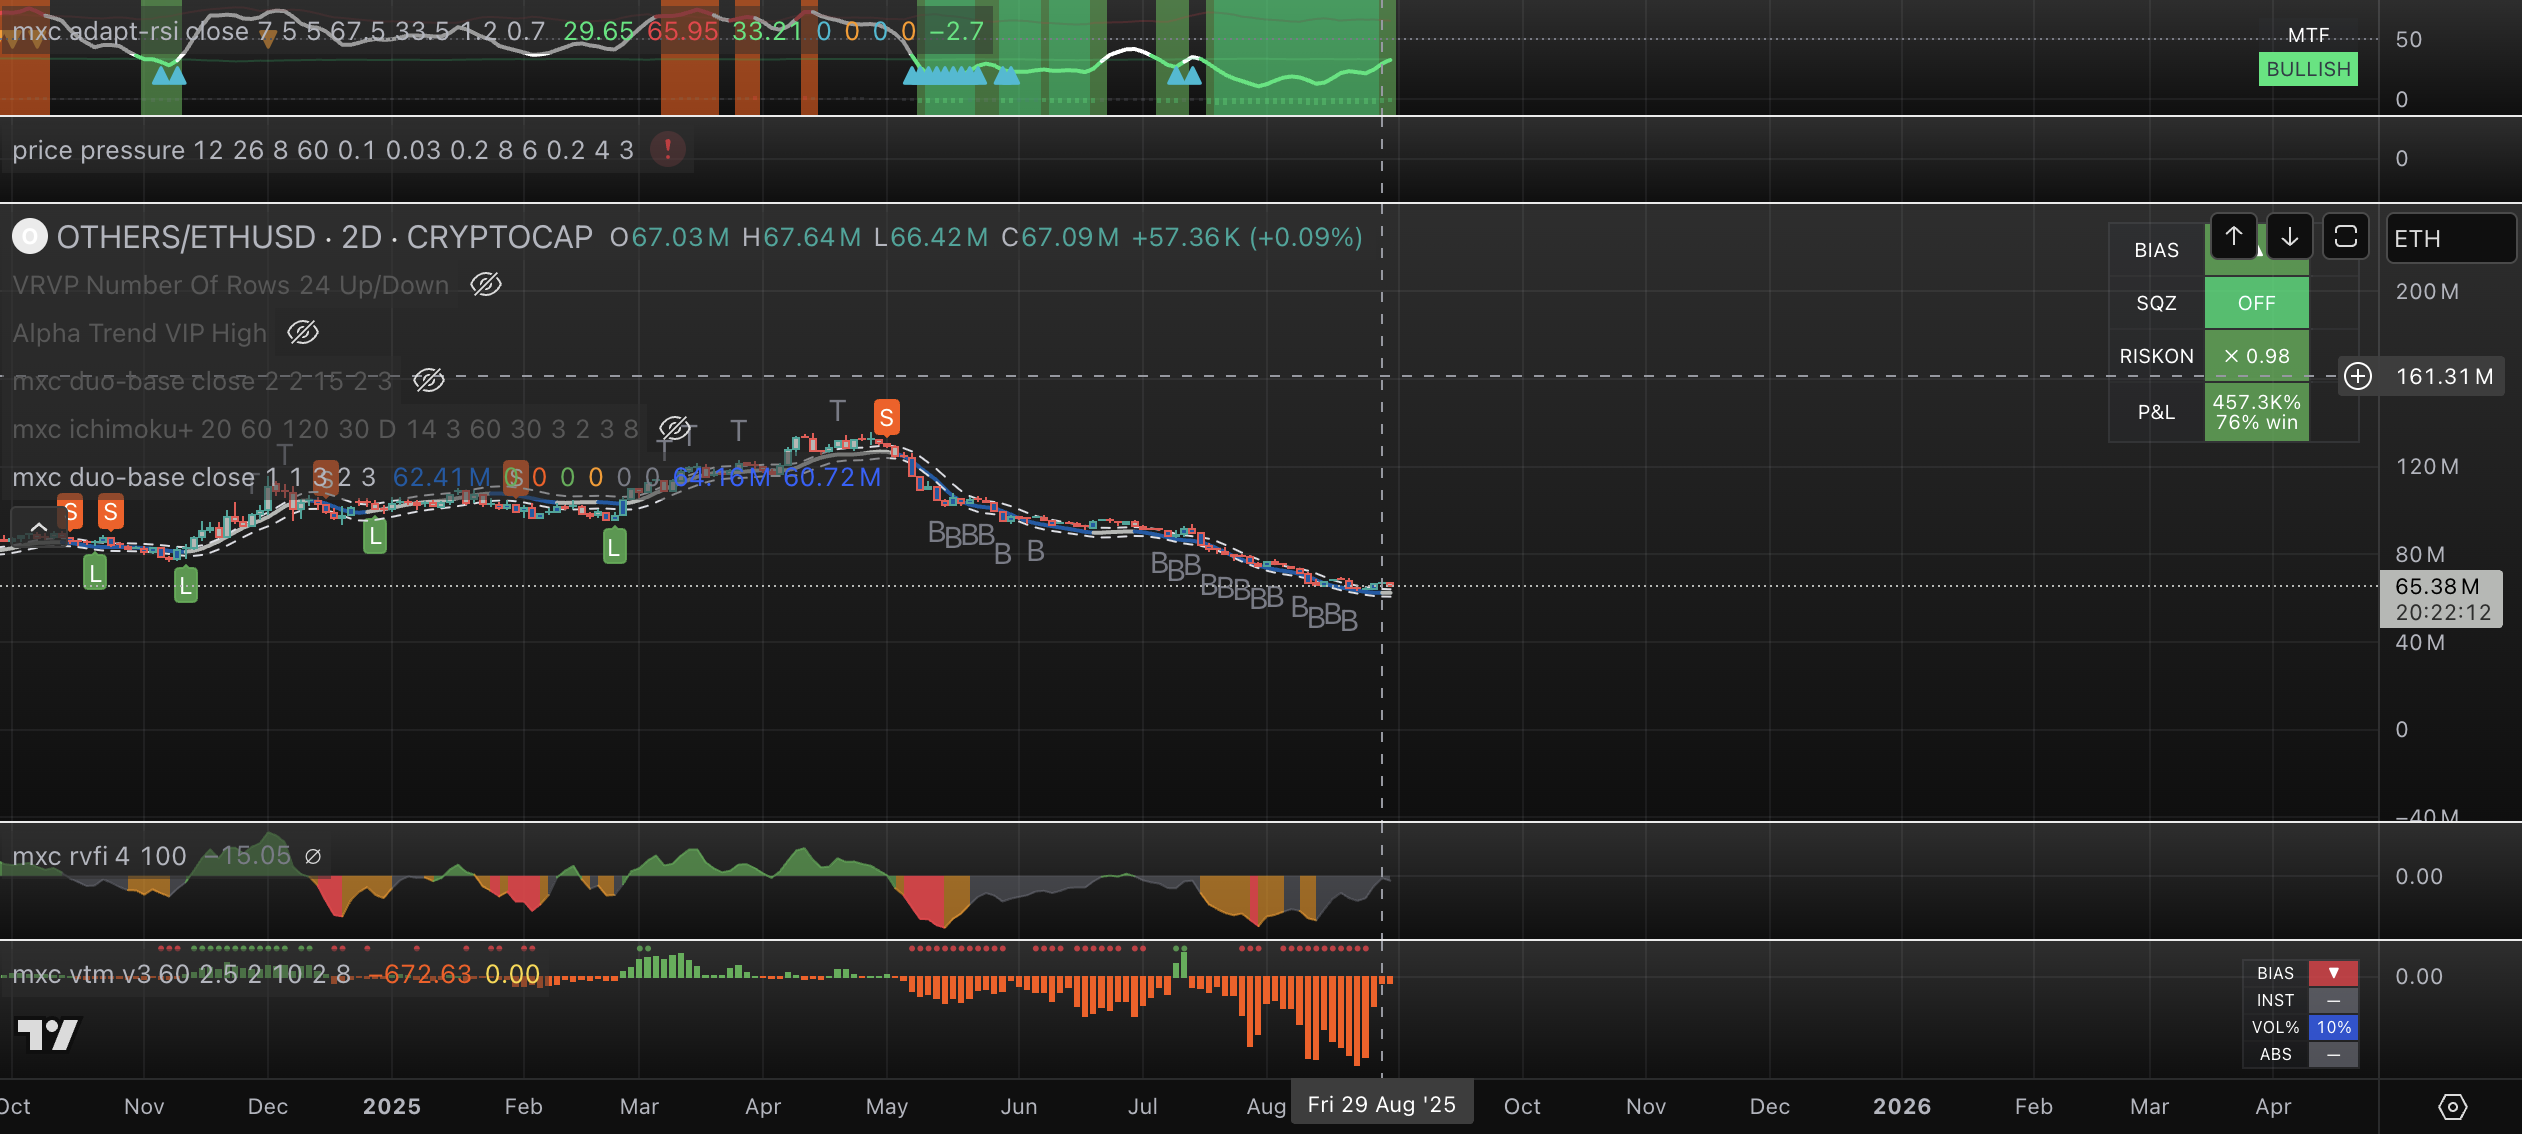
- OTHERS / ETH ratio - showing bullish Adaptive RSI across timeframes.
- Positive shift in momentum, RVFI and Volume pressure.
With clear shift in SOL we are waiting for similar shift in the OTHERS / ETH ration on the 2D and 3D timeframes - as the initial signal of the rotation into Alts.
For these reasons, our models continue to assign a ~70% probability to an eventual alt-season. This outcome, however, is contingent on two key factors: the return of sidelined retail capital and the emergence of a powerful new narrative.
Cycles Compass: Preparing for the Final Leg
Special thanks to Namzes, our Fox Strategist, for this section.
Our main thesis is that we are in the final topping phase of the 4-year cycle, and we are trying to navigate the next 2-3 months to capture a potential final leg up, keeping in mind that we are in the tail end of the bull run.
4-Year Cycle Is Peaking
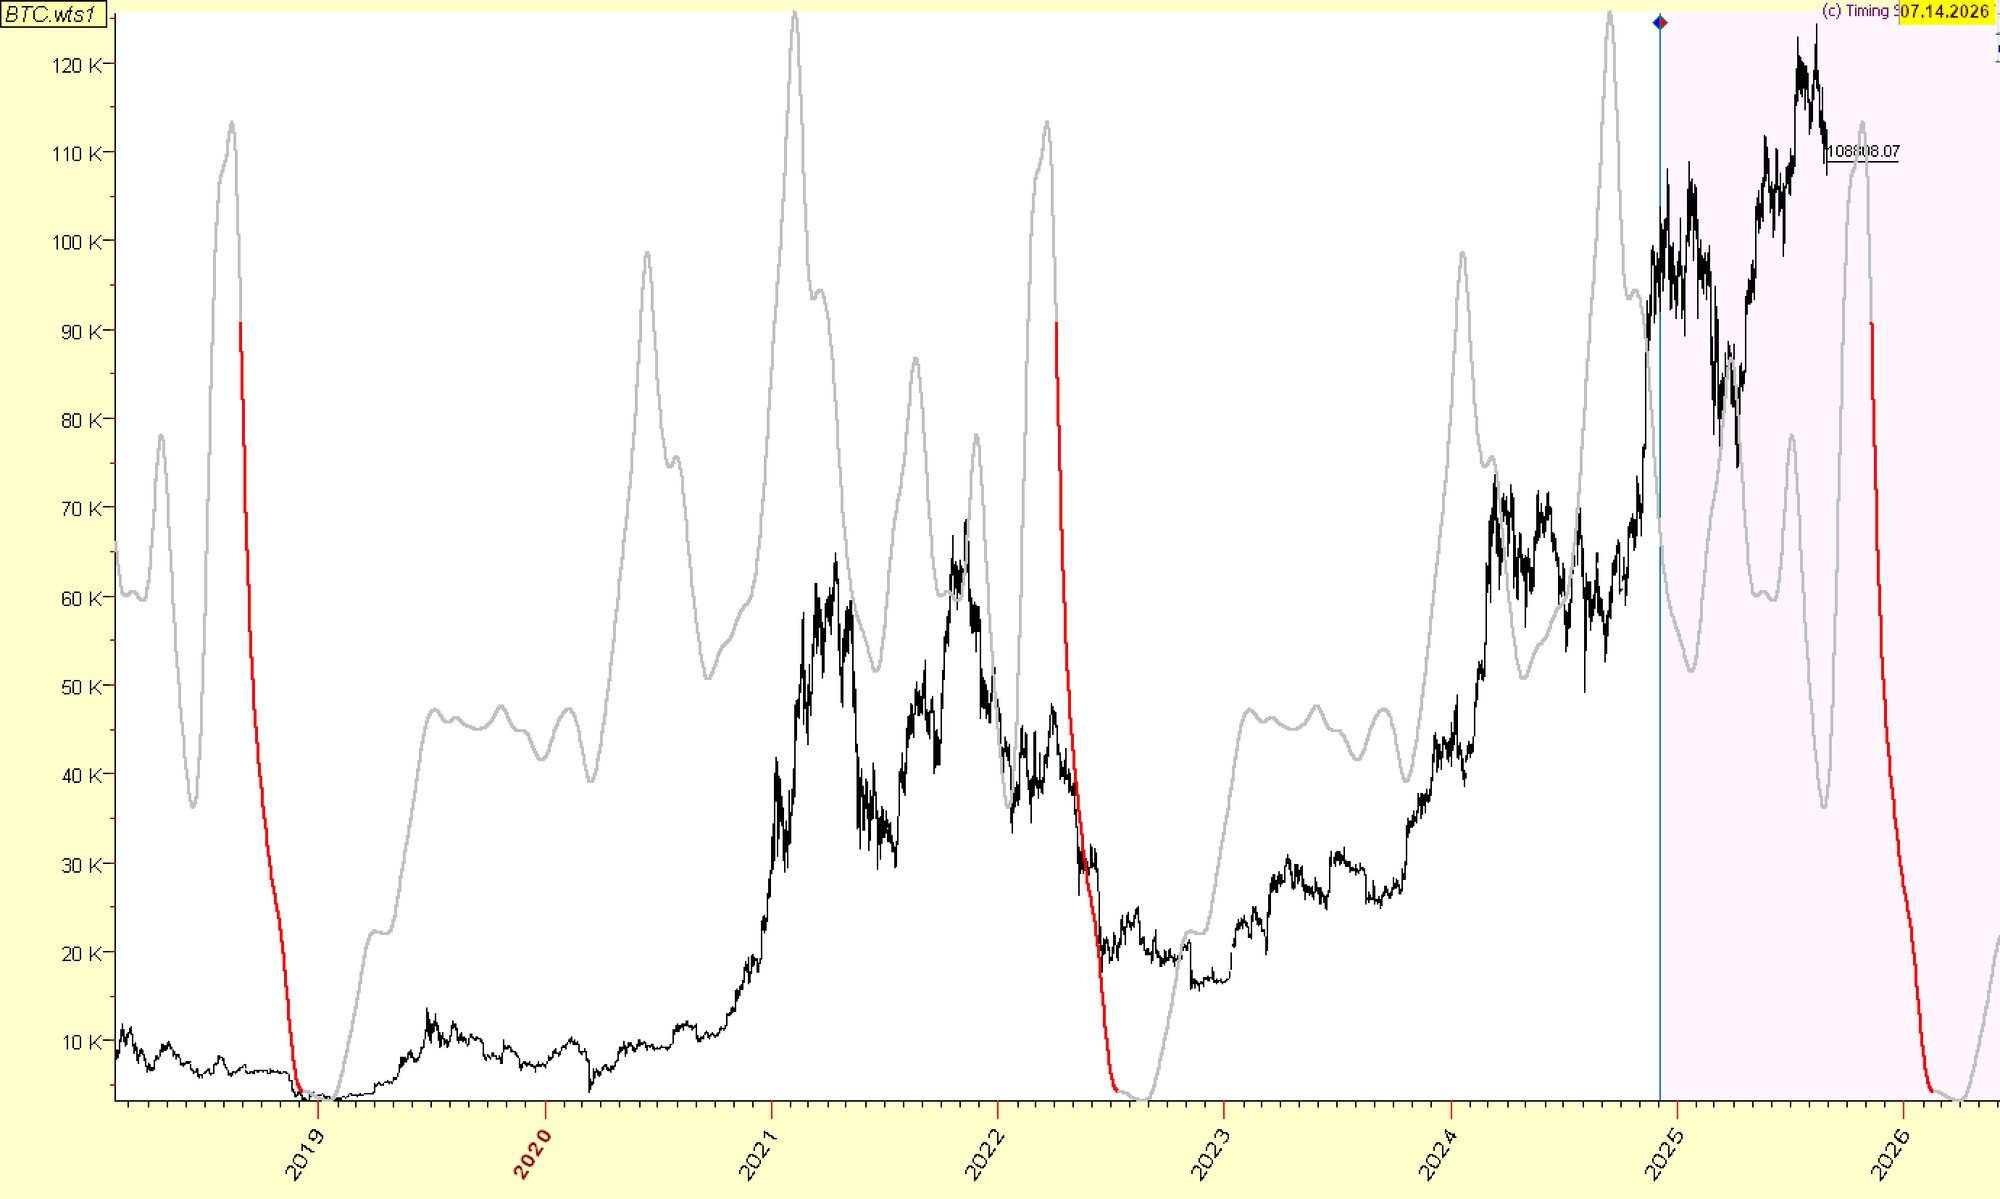
The window of opportunity here is very narrow—about 2 months. Around late October to early November, the cycle should make a hard turn down into 2026. We would be looking for models to show sell signals and look for exits. Opportunities to accumulate cheaper should arise in spring or even summer 2026, where we expect the next 4-year cycle low to hit.
Composite Cycles Projection for the Rest of 2026:
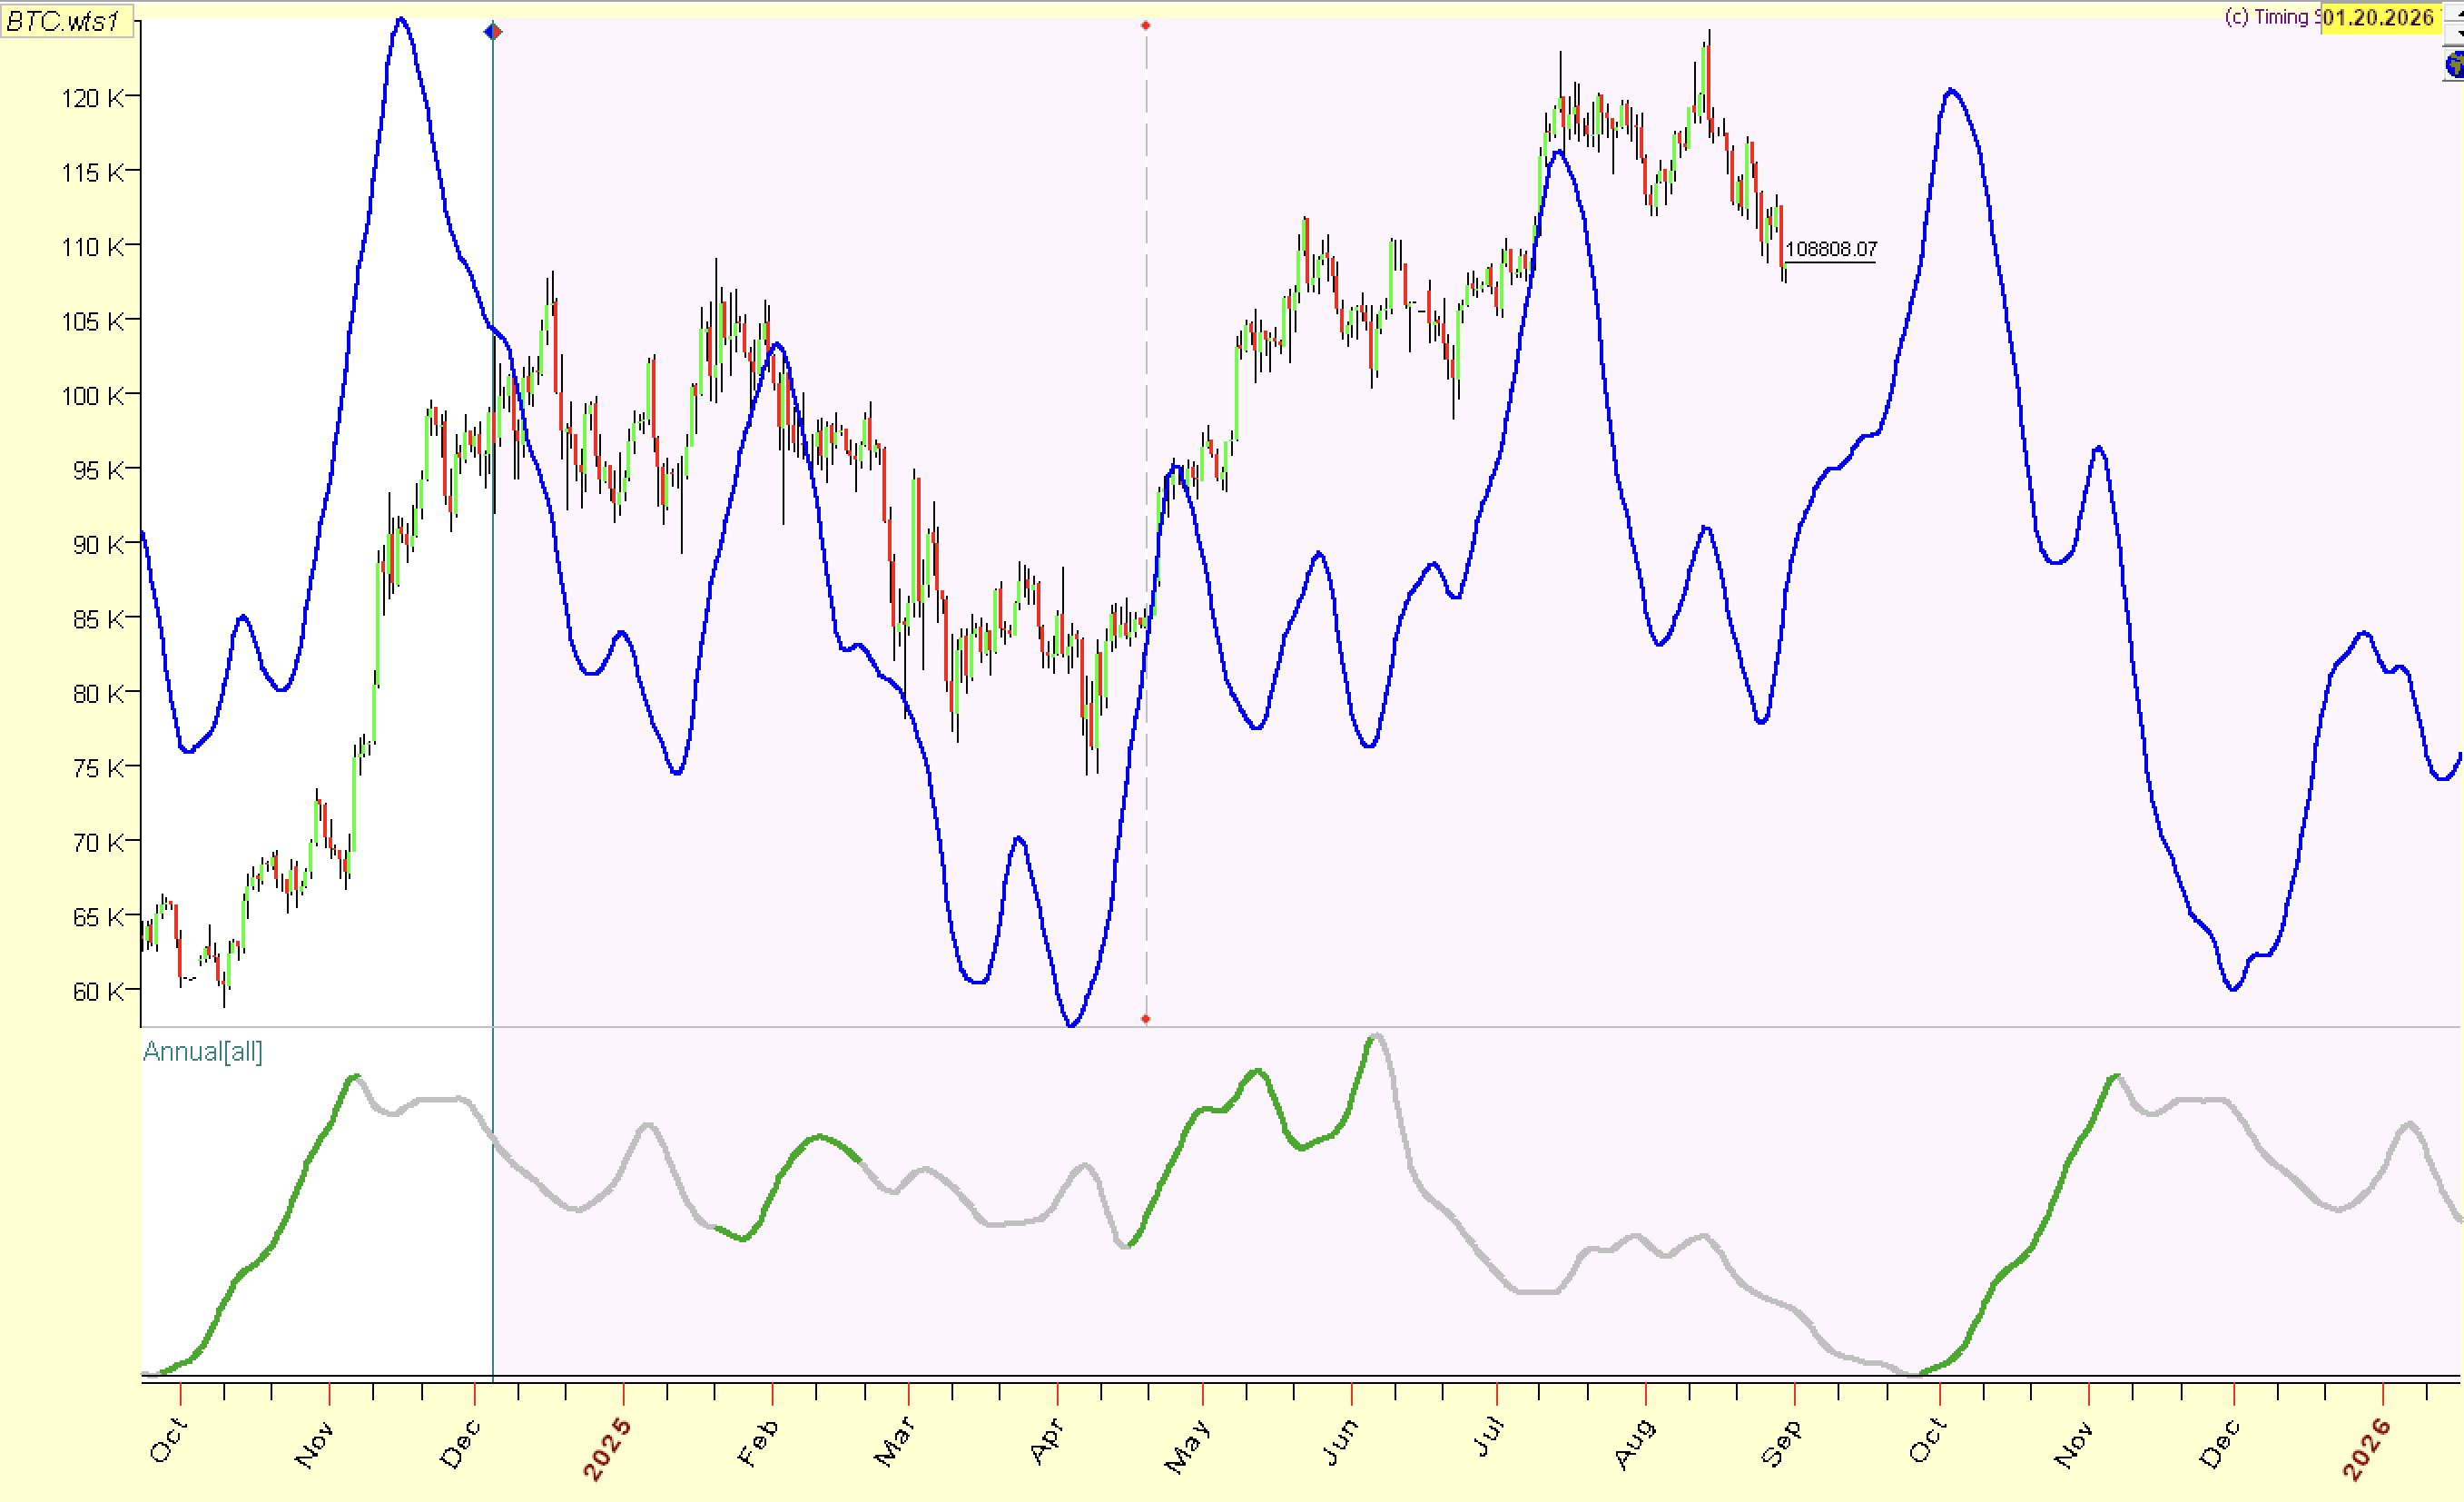
Shorter-term, we were anticipating an 80-day cycle low around the end of August or early September. This cycle has been quite consistent, is in sync with the average path of the 4-year cycle, and suggests an upside move into the second half of September, some type of peaking in October, and a down move in November.
Bonus: Seasonality Bitcoin seasonality is a small sample size game (n=15), so we don't put much weight into it; we will simply look at the data and have it in the back of our mind for reference. September 1-27 is typically a negative time period, while holding from Sep 27 to Oct 27, 80% of years were up with an average gain of 26% (median gain of 14.6%).
In Conclusion: A Note on Positioning & Risk
Before anyone panics, we are of the belief that ETH has not topped. However, history shows that every new all-time high is followed by a cooling-off period. If you are up significantly, your portfolio is probably over-indexed to crypto, and a small reduction in exposure is prudent risk management. We are not day traders; we make a few key moves focused on strategic positioning.
The chessboard is set. While equities navigate heightened risk, crypto majors are methodically building their bases. The signals are clear: favor patience now, but prepare for decisive action.
The market has grown up. So should our approach.
Now is the time to position for the final act.
PS. For the full context on our market thesis, a review of our previous briefings is essential. We recommend two key publications: our July State of Play and our Review of the Treasury Companies Play.


Disclaimer: This research is for informational and educational purposes only and does not constitute investment advice. Securities involve a high degree of risk. Investors should conduct their own independent due diligence or consult a licensed financial adviser before making any investment decisions.
Appendix: The Anatomy of Crypto Cycles
Understanding the Psychology, the Structural Shifts, and the Signal.
Bonus for our readers.
To operate effectively in any market, one must first understand its underlying drivers. In crypto, this is paramount. The market is driven by raw human psychology, leading to massive dislocations that are bigger and more sustained than in traditional finance. While institutional flows may eventually dampen this, crypto remains a less efficient arena—a place where understanding the cycle isn't just an edge; it's the entire game.
Phase 1: The Accumulation Base
Historically, crypto markets find their bottom only after a brutal capitulation phase. The signals of a true bottom are unambiguous for those who know what to look for:
- Leverage is fully flushed from the system.
- Sentiment turns to despair as previous “believers” give up.
- The narratives that once held up prices have failed.
- Forced sellers (defunct funds, collapsed exchanges) have been purged.
While retail is either too scared or has lost too much to participate, smart money with longer time horizons begins to accumulate. Dormant wallets reactivate. This is the quiet absorption phase, occurring while mainstream news declares crypto “dead”. This was the exact set of conditions that led us to issue our buy signal on Bitcoin in November 2022.
Phase 2: The Markup & The Wall of Worry
Even as price begins to slowly climb, the 80%+ drawdowns from the prior peak keep most participants frozen in fear. Bearish narratives about regulation, scams, and macro risks linger. This is the classic “wall of worry.”
Market participants ignore the improving fundamentals until a new narrative ignites mainstream interest, forcing skeptics to chase prices higher.
- 2016/2017 Catalyst: ICOs on Ethereum.
- 2020/2021 Catalysts: DeFi, NFTs, and BTC as an inflation hedge.
- Current Cycle Catalysts: Memecoins, AI, and regulatory clarity.
Phase 3: The Distribution Top
As the bull trend gains confirmation, the public ramps up leverage and risk, chasing the hottest narrative. Eventually, these narratives exhaust, growth plateaus, and momentum fizzles. People often point to a major macro shock as the cause of the top, but this is a first-level error. The shock is merely the nail in the coffin for a market that was already overextended, where smart money had already begun to exit.
The sentiment progression is predictable:
- Early Cycle: Retail disbelief, smart money optimism.
- Mid-Cycle: FOMO / chasing prices.
- Late Cycle: Everyone is all in; the marginal buyer is gone.
- End of Cycle: Sentiment flips, good news no longer moves price up, and a negative catalyst creates the top.
The Playbook: A Probabilistic Approach to Profits
Calling the absolute top is a fool's errand that often results in missing huge gains. The goal is not perfection but disciplined profit-taking. Our view is that securing ~80% of the gains from a crypto cycle is an A+ performance. Taking profit should feel more comfortable at a price you believe you are likely to see again in the next bear market.
One of our favorite second-level signals for a top is the arrival of a new “class” of participants. In 2020/2021, it was mass-market retail and corporations. In this cycle, it was key institutional players. When this new class runs out of fresh capital to provide inflows, you should be concerned.
The Current Signal: Where We Are in the Cycle
Our models indicate we are in the late stages of the current cycle, with less than six months remaining. However, we believe the subsequent bear market will not be as severe as historical crypto winters, due to stickier recurring capital inflows and less aggressive leverage in the system.
A Structural Shift: The ETF Effect on Volatility
The launch of spot Bitcoin ETFs in January 2024 has fundamentally dampened volatility. An analysis of BTC’s GARCH volatility shows that while volatility exceeded 150% during the 2022 panics, it has rarely surpassed 80% since the ETFs began trading, compressing toward a 40-50% range.
This lower volatility regime has critical implications:
- Lower Returns: As market cap and liquidity deepen, extreme returns become mathematically less likely. When volatility halves, you need twice the capital for the same risk/return profile.
- The Silver Lining: Dampened volatility makes Bitcoin more palatable as an "investment grade asset" and addresses the long-term concern that it is "too volatile" to function as a currency.
Key Strategic Takeaways from this New Regime:
- Volatility is likely to remain dampened versus historical norms in both bull and bear markets.
- Crashes are likely to reach lower peak volatility than historical crashes.
- Bull markets will likely exhibit "slow grind up" conditions, with extended ranges followed by isolated pockets of strong performance.
- Lower volatility means transaction costs take a larger share of returns. You must reduce your trading frequency—ideally to once per year or less.
- ETFs, or "paper" Bitcoin, are much cheaper to trade or hedge and this advantage matters significantly in low-volatility regimes.